Categories
Science

Mastering Spectrophotometry: A Comprehensive Guide to Using a Spectrophotometer

Introduction: Spectrophotometry is a powerful analytical technique used in various scientific disciplines to measure the absorption or transmission of light by a sample. Whether you’re a student learning the basics of spectroscopy or a researcher conducting advanced experiments, understanding how to use a spectrophotometer is essential for quantitative analysis and characterization of substances. In this extensive guide, we’ll explore the step-by-step process of using a spectrophotometer, covering everything from instrument setup and calibration to sample preparation and data analysis, with practical tips and insights along the way.

Part 1: Understanding Spectrophotometry and Principles of Light Absorption

  1. Introduction to Spectrophotometry: Spectrophotometry is a technique used to measure the interaction between electromagnetic radiation (light) and matter. It involves analyzing the amount of light absorbed or transmitted by a sample at different wavelengths.
  2. Principles of Light Absorption: Light absorption occurs when photons of specific wavelengths are absorbed by molecules, causing electronic transitions or vibrational excitations. The extent of absorption depends on the concentration and nature of the absorbing species.

Part 2: Components and Operation of a Spectrophotometer

  1. Basic Components of a Spectrophotometer: Familiarize yourself with the main components of a spectrophotometer, including the light source, monochromator, sample holder, detector, and display/interface. Understand the function of each component in the measurement process.
  2. Operating Modes: Spectrophotometers can operate in various modes, including absorbance, transmittance, and concentration modes. Choose the appropriate mode for your experiment based on the type of analysis and the properties of the sample.

Part 3: Instrument Setup and Calibration

  1. Instrument Setup: Set up the spectrophotometer according to the manufacturer’s instructions, ensuring that all components are properly connected and aligned. Calibrate the instrument if necessary to ensure accurate and reliable measurements.
  2. Wavelength Selection: Select the appropriate wavelength range and resolution for your experiment based on the absorption characteristics of the sample. Use the monochromator or wavelength selector to adjust the wavelength settings.

Part 4: Sample Preparation and Measurement

  1. Preparing the Sample: Prepare the sample for analysis according to the specific requirements of your experiment. Ensure that the sample is homogeneous, free from contaminants, and compatible with the measurement mode (e.g., liquid samples for transmission measurements).
  2. Loading the Sample: Place the sample in the appropriate sample holder or cuvette, ensuring that it covers the optical path evenly. Use a clean cuvette without scratches or defects to minimize interference with the measurement.
  3. Taking Measurements: Initiate the measurement process by selecting the desired measurement mode (e.g., absorbance or transmittance) and setting the wavelength and other parameters. Record the baseline measurement using a blank sample (e.g., solvent) before analyzing the sample of interest.

Part 5: Data Analysis and Interpretation

  1. Recording Measurements: Record the absorbance or transmittance values obtained from the spectrophotometer for each sample at the specified wavelength(s). Take multiple measurements and calculate the average to improve accuracy and precision.
  2. Calculating Concentrations: Use the Beer-Lambert Law (A = εlc) to calculate the concentration of the analyte in the sample based on the absorbance (A), molar absorptivity (ε), path length (l), and concentration (c). Apply appropriate corrections and conversions as needed.

Part 6: Troubleshooting and Optimization

  1. Quality Control and Validation: Perform regular quality control checks and validation experiments to ensure the accuracy and reliability of spectrophotometric measurements. Use certified reference materials and standard operating procedures for calibration and verification.
  2. Optimizing Measurement Conditions: Optimize measurement conditions, such as wavelength range, path length, and sample volume, to maximize sensitivity and signal-to-noise ratio. Minimize sources of interference, such as scattering or stray light, to improve measurement accuracy.

Conclusion

Using a spectrophotometer is a versatile and powerful technique for quantitative analysis and characterization of substances in various scientific disciplines. By following the comprehensive guide outlined above, you’ll be equipped with the knowledge and skills to use a spectrophotometer effectively and accurately. Remember to carefully prepare samples, calibrate the instrument, and analyze data systematically to obtain meaningful results. With practice and proficiency, you can harness the capabilities of spectrophotometry to advance research, solve problems, and deepen our understanding of the natural world.

Categories
Science

Mastering Chemical Equations: A Comprehensive Guide to Balancing Chemical Equations

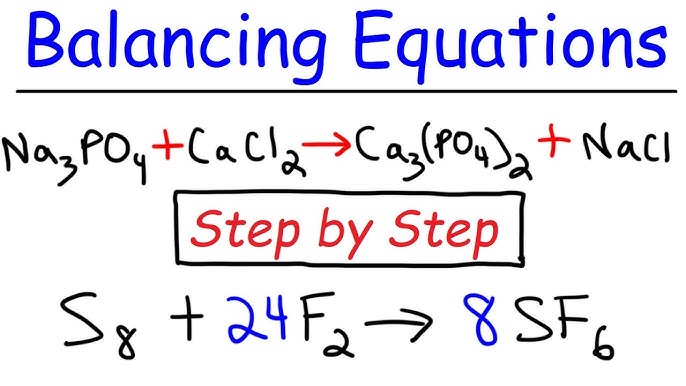
Introduction: Balancing chemical equations is a fundamental skill in chemistry that allows scientists to describe chemical reactions accurately. Whether you’re a student learning the basics of chemistry or a seasoned researcher analyzing complex reactions, understanding how to balance chemical equations is essential for predicting reaction outcomes and understanding chemical behavior. In this extensive guide, we’ll explore the step-by-step process of balancing chemical equations, covering everything from identifying reactants and products to applying the principles of conservation of mass and charge, with practical tips and insights along the way.

Part 1: Understanding Chemical Equations and Stoichiometry

  1. Introduction to Chemical Equations: Chemical equations are symbolic representations of chemical reactions, showing the reactants on the left side and the products on the right side. Each chemical species is represented by its chemical formula, and the coefficients indicate the relative amounts of reactants and products.
  2. Stoichiometry Basics: Stoichiometry is the branch of chemistry that deals with the quantitative relationships between reactants and products in chemical reactions. It involves balancing equations, determining reaction stoichiometry, and calculating reactant and product amounts.

Part 2: Identifying Reactants and Products

  1. Recognizing Chemical Species: Identify the chemical species involved in the reaction, including reactants and products. Determine the chemical formulas of each species based on their elemental composition.
  2. Writing Chemical Equations: Write the chemical equation for the reaction, representing the reactants on the left side and the products on the right side. Ensure that the chemical formulas are correct and balanced, with appropriate subscripts and coefficients.

Part 3: Applying Conservation Principles

  1. Conservation of Mass: Balancing chemical equations involves applying the principle of conservation of mass, which states that mass is neither created nor destroyed in a chemical reaction. The total mass of reactants must equal the total mass of products.
  2. Conservation of Charge: In addition to mass, chemical equations must also satisfy the principle of conservation of charge. The total charge of reactants must equal the total charge of products, accounting for the transfer of electrons in ionic reactions.

Part 4: Balancing Chemical Equations

  1. Start with the Most Complex Compound: Begin balancing the equation by adjusting coefficients for the most complex compound or species in the reaction. Balance elements that appear in only one reactant and one product first.
  2. Adjusting Coefficients: Use coefficients to balance the number of atoms of each element on both sides of the equation. Start with elements that appear in multiple compounds and balance them one at a time, ensuring that the total number of atoms is equal on both sides.
  3. Using Trial and Error: Experiment with different coefficients to achieve balance in the equation. Adjust coefficients incrementally and systematically, checking the balance of each element after each adjustment.

Part 5: Verifying and Refining

  1. Check for Balance: Verify that the equation is balanced by counting the number of atoms of each element on both sides. Ensure that the total mass and charge are conserved and that all coefficients are in the simplest whole-number ratio.
  2. Refine as Needed: Refine the coefficients further if necessary to achieve the simplest and most balanced equation possible. Use common multiples to simplify coefficients and ensure that the equation is clear and concise.

Part 6: Practice and Application

  1. Practice Problems: Reinforce your understanding of balancing chemical equations by practicing with a variety of problems and reactions. Start with simple reactions and gradually progress to more complex scenarios.
  2. Real-World Applications: Apply your knowledge of balancing chemical equations to real-world scenarios, such as industrial chemical processes, environmental reactions, and biological pathways. Analyze reaction stoichiometry and predict reaction outcomes based on balanced equations.

Conclusion

Balancing chemical equations is a fundamental skill in chemistry that requires practice, patience, and attention to detail. By following the comprehensive guide outlined above, you’ll be equipped with the knowledge and techniques to balance chemical equations effectively and accurately. Remember to apply the principles of conservation of mass and charge, start with the most complex compounds, and refine coefficients systematically to achieve balance. With dedication and proficiency, you can master the art of balancing chemical equations and gain a deeper understanding of chemical reactions and their significance in the world around us.

Categories
Science

Mastering Titration: A Comprehensive Guide to Performing Titration Experiments

Introduction: Titration is a fundamental technique used in chemistry to determine the concentration of a substance in a solution. Whether you’re a student, researcher, or professional chemist, understanding how to perform titration accurately is essential for conducting precise and reliable experiments. In this extensive guide, we’ll explore the step-by-step process of performing titration experiments, covering everything from preparing solutions and choosing indicators to conducting the titration and calculating results, with practical tips and insights along the way.

Part 1: Understanding Titration and Its Principles

  1. Introduction to Titration: Titration is a quantitative analytical technique used to determine the concentration of a known substance (the analyte) in a solution by reacting it with a known volume and concentration of another substance (the titrant).
  2. Principles of Titration: Titration relies on the principle of stoichiometry, where the reaction between the analyte and titrant occurs in a precise and controlled manner. The endpoint of the titration is determined by a visual or instrumental indicator, signaling the completion of the reaction.

Part 2: Preparing Solutions and Equipment

  1. Preparing the Analyte Solution: Start by preparing the analyte solution, which contains the substance whose concentration you want to determine. Measure and dilute the analyte to the appropriate concentration using a volumetric flask and deionized water.
  2. Preparing the Titrant Solution: Prepare the titrant solution, which contains the substance of known concentration that will react with the analyte. Use a standardized solution of the titrant, carefully measured and diluted as needed.
  3. Setting Up Equipment: Set up the necessary equipment for titration, including burettes, pipettes, Erlenmeyer flasks, and a magnetic stirrer (if applicable). Rinse all glassware with the appropriate solvents to remove any contaminants.

Part 3: Choosing Indicators and Endpoint Detection

  1. Selecting an Indicator: Choose a suitable indicator based on the nature of the reaction and the pH range of the titration. Common indicators include phenolphthalein, methyl orange, and bromothymol blue, each with its own color change at a specific pH.
  2. Determining the Endpoint: Decide on the endpoint of the titration, which is the point at which the reaction between the analyte and titrant is complete. Use visual cues, such as color changes in the indicator solution, or instrumental methods, such as pH meters or conductivity meters, to detect the endpoint.

Part 4: Conducting the Titration

  1. Filling the Burette: Fill the burette with the titrant solution, taking care to remove any air bubbles and ensure the meniscus is at the zero mark. Record the initial volume of the titrant.
  2. Adding the Indicator: Add a few drops of the selected indicator to the analyte solution in the Erlenmeyer flask. Swirl the flask gently to mix the solutions and ensure uniform color distribution.
  3. Titration Process: Begin the titration by slowly adding the titrant solution from the burette to the analyte solution in the Erlenmeyer flask, while swirling the flask continuously. Observe any changes in color or other indicators of the endpoint.
  4. Reaching the Endpoint: Continue adding the titrant solution drop by drop as you approach the expected endpoint. Slow down the addition of titrant as you get closer to the endpoint to avoid overshooting.
  5. Recording the Final Volume: Stop the titration when the endpoint is reached, indicated by a persistent color change or other predetermined criteria. Record the final volume of the titrant solution in the burette.

Part 5: Calculating Results and Analyzing Data

  1. Calculating the Concentration: Use the volume and concentration of the titrant solution, as well as the stoichiometry of the reaction, to calculate the concentration of the analyte solution. Apply the appropriate formula based on the reaction equation.
  2. Analyzing Data and Errors: Analyze the data obtained from the titration experiment, including any sources of error or uncertainty. Consider factors such as burette reading errors, indicator choice, and experimental conditions that may affect the accuracy of the results.

Part 6: Troubleshooting and Optimization

  1. Troubleshooting Common Issues: Identify and troubleshoot common issues that may arise during titration experiments, such as titrant contamination, equipment calibration errors, or incorrect indicator selection. Take corrective actions to address any issues and improve the reliability of your results.
  2. Optimizing Experimental Conditions: Optimize experimental conditions, such as temperature, pH, and reaction kinetics, to ensure reproducibility and accuracy in titration experiments. Conduct control experiments and validation studies to verify the reliability of your results.

Conclusion

Performing titration experiments is a fundamental skill in chemistry that requires careful planning, precision, and attention to detail. By following the comprehensive guide outlined above, you’ll be equipped with the knowledge and techniques to conduct titration experiments effectively and obtain reliable results. Remember to practice proper laboratory techniques, adhere to safety protocols, and consult reference materials and experienced professionals when needed. With dedication and proficiency, you can master the art of titration and contribute to the advancement of scientific knowledge in your field.

Categories
Science

Mastering Microscopy: A Comprehensive Guide to Using a Microscope

Introduction: Microscopes are invaluable tools used in scientific research, education, and various fields of industry for observing and analyzing microscopic specimens. Whether you’re a student, researcher, or professional, understanding how to use a microscope effectively is essential for exploring the intricate details of the microscopic world. In this extensive guide, we’ll delve into the step-by-step process of using a microscope, covering everything from setting up the microscope to adjusting magnification and focusing techniques, with practical tips and insights along the way.

Part 1: Understanding Microscopes and Their Components

  1. Types of Microscopes: Familiarize yourself with the different types of microscopes, including light microscopes, electron microscopes, and stereo microscopes. Understand their principles of operation and applications in various fields.
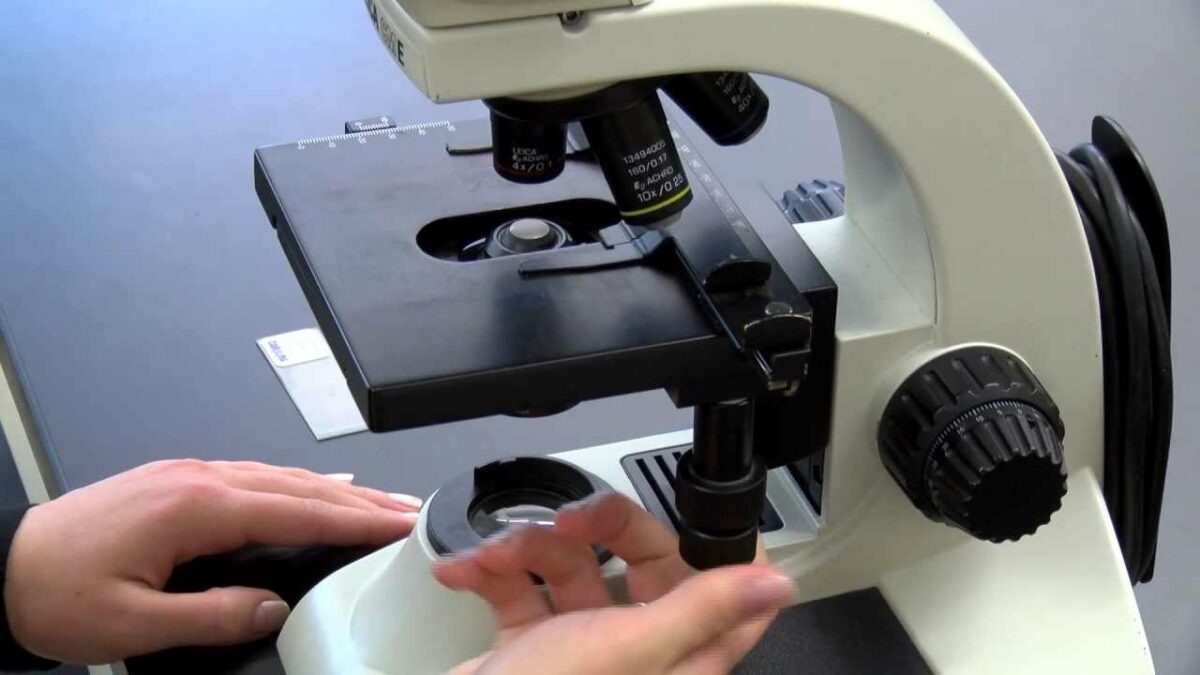
  2. Components of a Microscope: Learn about the essential components of a microscope, such as the eyepiece, objective lenses, stage, condenser, and light source. Understand the function of each component and how they work together to magnify and illuminate specimens.

Part 2: Setting Up the Microscope

  1. Preparing the Workspace: Choose a clean and well-lit workspace to set up your microscope. Ensure that you have access to a stable surface and adequate lighting for observing specimens.
  2. Assembling the Microscope: Follow the manufacturer’s instructions to assemble the microscope, including attaching the eyepieces, objective lenses, and stage. Ensure that all components are securely fastened and aligned properly.

Part 3: Adjusting Magnification and Illumination

  1. Selecting the Objective Lens: Choose the appropriate objective lens based on the level of magnification required for your specimen. Start with the lowest magnification objective and gradually increase magnification as needed.
  2. Adjusting the Focus: Use the coarse and fine focus knobs to adjust the focus of the microscope. Start with the coarse focus knob to roughly focus on the specimen, then use the fine focus knob for precise adjustments.
  3. Optimizing Illumination: Adjust the intensity and angle of the light source to optimize illumination of the specimen. Use the condenser and diaphragm controls to control the amount and direction of light passing through the specimen.

Part 4: Observing and Analyzing Specimens

  1. Placing the Specimen: Carefully place the specimen on the microscope stage, ensuring that it is centered and securely mounted. Use clips or slide holders to hold the specimen in place.
  2. Exploring the Specimen: Use the microscope controls to move the stage and adjust the position of the specimen. Explore different areas of the specimen by scanning horizontally and vertically.
  3. Recording Observations: Take notes and record observations of the specimen, including its appearance, structure, and any notable features or characteristics. Use a camera attachment or digital imaging software to capture images of the specimen for documentation and analysis.

Part 5: Maintenance and Care

  1. Cleaning and Maintenance: Regularly clean and maintain your microscope to ensure optimal performance and longevity. Use lens paper and cleaning solutions to remove dust and debris from the lenses and other components.
  2. Storage and Protection: Store your microscope in a clean and dry environment, away from dust, moisture, and direct sunlight. Cover the microscope with a dust cover when not in use to protect it from damage and contamination.

Conclusion

Using a microscope is a skill that requires patience, precision, and attention to detail. By following the comprehensive guide outlined above, you’ll be equipped with the knowledge and techniques to use a microscope effectively for observing and analyzing specimens in various fields of study. Remember to practice regularly, familiarize yourself with the specific features and controls of your microscope, and seek guidance from experienced users or instructors when needed. With dedication and proficiency, you can unlock the fascinating world of microscopy and uncover hidden insights and discoveries in the microscopic realm.

Categories
Science

Crafting Scholarly Insights: A Comprehensive Guide to Writing a Scientific Research Paper

Introduction: Writing a scientific research paper is a rigorous and methodical process that requires careful planning, thorough research, and precise communication of findings. Whether you’re a seasoned researcher or a novice scholar, mastering the art of writing a research paper is essential for contributing to the advancement of knowledge in your field. In this extensive guide, we’ll explore the step-by-step process of writing a scientific research paper, covering everything from selecting a topic and conducting research to structuring your paper and presenting your findings, with practical tips and academic insights along the way.

Part 1: Selecting a Topic and Defining Objectives

  1. Choosing a Research Topic: Start by identifying a topic that interests you and aligns with your expertise and academic goals. Consider current trends, gaps in existing literature, and potential research questions or hypotheses that warrant investigation.
  2. Defining Research Objectives: Clearly articulate the objectives and aims of your research, outlining the specific questions you intend to address and the hypotheses you aim to test. Ensure that your research objectives are achievable, relevant, and aligned with the scope of your study.

Part 2: Conducting Literature Review and Background Research

  1. Reviewing Existing Literature: Conduct a comprehensive review of existing literature and research related to your topic. Identify key theories, methodologies, and findings that inform your research and provide context for your study.
  2. Gathering Background Information: Gather background information and relevant data from various sources, including scholarly articles, books, journals, and online databases. Critically evaluate the credibility and reliability of sources to ensure the validity of your research.

Part 3: Formulating Hypotheses and Research Design

  1. Formulating Hypotheses: Based on your literature review and background research, formulate clear and testable hypotheses that address your research objectives. Ensure that your hypotheses are specific, measurable, and grounded in existing theory and evidence.
  2. Designing Research Methodology: Choose appropriate research methods and methodologies to test your hypotheses and collect data. Consider factors such as sample size, data collection techniques, and statistical analysis methods to ensure the rigor and validity of your research.

Part 4: Writing the Research Paper

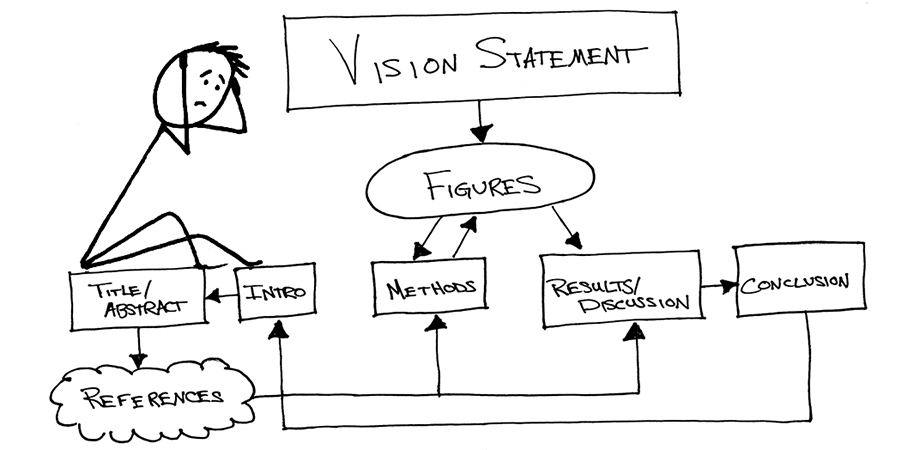
  1. Structuring the Paper: Organize your research paper into distinct sections, including an introduction, literature review, methodology, results, discussion, and conclusion. Follow the guidelines and formatting requirements of your target journal or academic institution.
  2. Writing the Introduction: Introduce your research topic, objectives, and significance in the introduction section. Provide background information, review relevant literature, and clearly state the research questions or hypotheses that guide your study.
  3. Presenting Methodology and Results: Describe your research methodology in detail, including the study design, data collection procedures, and statistical analysis methods. Present your findings objectively and concisely in the results section, using tables, figures, and graphs to enhance clarity and comprehension.
  4. Analyzing and Discussing Results: Analyze your research findings in the discussion section, interpreting the implications and significance of your results in relation to your research objectives and hypotheses. Compare your findings with existing literature and discuss any limitations or constraints of your study.
  5. Concluding the Paper: Summarize the key findings and contributions of your research in the conclusion section. Revisit your research objectives and hypotheses, highlight the significance of your findings, and suggest avenues for future research or exploration.

Part 5: Revising and Refining the Paper

  1. Peer Review and Feedback: Seek feedback from peers, mentors, or colleagues on your research paper, soliciting constructive criticism and suggestions for improvement. Incorporate feedback and revisions to strengthen the clarity, coherence, and impact of your paper.
  2. Editing and Proofreading: Review your research paper for grammar, spelling, punctuation, and formatting errors. Ensure consistency in style, tone, and citation format throughout the paper. Consider using professional editing services or proofreading tools to enhance the quality of your writing.

Conclusion

Writing a scientific research paper is a challenging yet rewarding endeavor that requires diligence, precision, and clarity of thought. By following the comprehensive guide outlined above, you’ll be equipped with the knowledge and skills to navigate the complexities of the research process and communicate your findings effectively to the academic community. Remember to approach each stage of the research process with curiosity, rigor, and integrity, and strive to contribute meaningfully to the advancement of knowledge in your field. With dedication and perseverance, you can craft scholarly insights that inspire curiosity, spark dialogue, and drive innovation in your discipline.

Categories
Science

Mastering Electromagnetic Field Measurement: A Comprehensive Guide for Engineers, Scientists, and Health Professionals

Introduction: Electromagnetic fields (EMFs) are pervasive in modern society, emanating from various sources such as electrical power lines, electronic devices, communication networks, and industrial equipment. Measuring EMFs is essential for assessing exposure levels, ensuring regulatory compliance, and evaluating potential health risks associated with electromagnetic radiation. In this comprehensive guide, we delve into the principles, methods, and considerations involved in measuring electromagnetic fields, providing valuable insights for engineers, scientists, and health professionals.

  1. Understanding Electromagnetic Fields: Electromagnetic fields consist of electric and magnetic fields that oscillate in space and time, carrying energy and information through the interaction of electric charges and magnetic dipoles. EMFs are characterized by their frequency, wavelength, amplitude, and polarization, with different frequency ranges corresponding to distinct regions of the electromagnetic spectrum, such as radiofrequency (RF), microwave, infrared, visible light, ultraviolet, X-ray, and gamma-ray radiation.
  2. Types of Electromagnetic Field Measurements: Electromagnetic field measurements encompass a wide range of parameters, including electric field strength, magnetic field flux density, power density, frequency spectrum, modulation characteristics, and polarization orientation. Measurement techniques vary depending on the specific requirements of the application, such as environmental monitoring, occupational safety, electromagnetic compatibility (EMC) testing, and biomedical research.
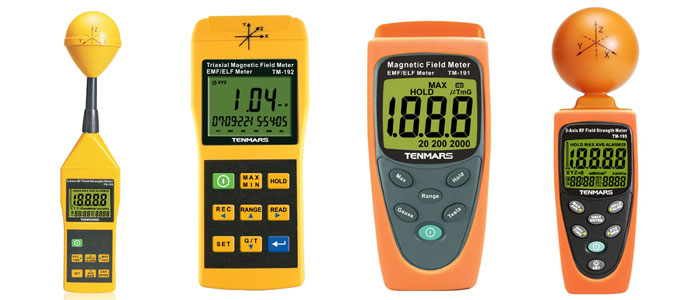
  3. Instrumentation for EMF Measurements: A variety of instruments and devices are available for measuring electromagnetic fields, ranging from simple handheld meters to sophisticated laboratory-grade equipment. Common instruments include electric field meters, magnetic field meters, spectrum analyzers, RF power meters, dosimeters, and probes for near-field and far-field measurements. These instruments utilize different sensing technologies, such as electric field antennas, magnetic field sensors, and semiconductor detectors, to capture and quantify electromagnetic radiation.
  4. Measurement Standards and Guidelines: International organizations, regulatory agencies, and standards bodies establish guidelines and regulations for EMF exposure limits and measurement procedures to ensure public safety and environmental protection. Organizations such as the International Commission on Non-Ionizing Radiation Protection (ICNIRP), the Institute of Electrical and Electronics Engineers (IEEE), and national regulatory agencies publish standards and guidelines for EMF measurements, including reference levels, measurement protocols, and safety thresholds.
  5. Measurement Techniques and Procedures: Electromagnetic field measurements involve systematic procedures for surveying, monitoring, and assessing EMF levels in different environments and scenarios. Field measurements may include site surveys, point measurements, area mapping, and time-series monitoring to capture variations in EMF levels over space and time. Calibration of measurement instruments, environmental factors, and measurement uncertainties must be taken into account to ensure accurate and reliable results.
  6. Occupational and Environmental Monitoring: Occupational and environmental monitoring of electromagnetic fields is conducted to evaluate exposure levels in workplaces, residential areas, public spaces, and sensitive environments. Occupational exposure assessments are performed in compliance with occupational safety regulations to protect workers from excessive EMF exposure in industrial settings, such as power plants, telecommunications facilities, and medical facilities. Environmental monitoring assesses EMF levels in the natural environment, urban areas, and near EMF-emitting sources to identify potential hotspots and mitigate risks to public health and safety.
  7. Electromagnetic Compatibility Testing: Electromagnetic compatibility (EMC) testing is conducted to assess the electromagnetic interference (EMI) potential of electronic devices, equipment, and systems and ensure their reliable operation in the presence of electromagnetic fields. EMC testing involves measuring radiated emissions, conducted emissions, immunity levels, and susceptibility to external electromagnetic disturbances according to international EMC standards and regulations. Compliance with EMC requirements is essential for product certification, regulatory approval, and market access.
  8. Biomedical and Health Effects Research: Biomedical research investigates the potential health effects of electromagnetic fields on biological systems, including human health risks associated with EMF exposure. Epidemiological studies, laboratory experiments, and animal models are used to assess the relationship between EMF exposure and adverse health outcomes, such as cancer, neurodegenerative diseases, reproductive effects, and electromagnetic hypersensitivity (EHS). Dosimetry studies quantify EMF absorption and tissue exposure levels to correlate with biological effects and establish exposure guidelines for protecting public health.
  9. Risk Communication and Public Awareness: Effective risk communication and public awareness campaigns are essential for informing stakeholders, raising awareness, and addressing concerns about electromagnetic field exposure and potential health risks. Educational initiatives, outreach programs, and media campaigns provide accurate information, dispel misconceptions, and empower individuals to make informed decisions about EMF exposure mitigation, risk reduction strategies, and precautionary measures.
  10. Emerging Technologies and Future Trends: Advances in technology, such as 5G wireless networks, Internet of Things (IoT) devices, and electric vehicle (EV) charging infrastructure, are driving new challenges and opportunities in electromagnetic field measurement and management. Emerging technologies, such as real-time monitoring systems, wearable sensors, and predictive modeling tools, offer innovative solutions for monitoring, analyzing, and mitigating EMF exposure in diverse applications and environments.

Conclusion: Measuring electromagnetic fields is a multidisciplinary endeavor that combines principles of physics, engineering, environmental science, and public health to assess exposure levels, ensure regulatory compliance, and protect human health and safety. By understanding the principles, methods, and considerations involved in EMF measurements, engineers, scientists, and health professionals can effectively evaluate EMF risks, implement appropriate mitigation strategies, and promote responsible use of electromagnetic technologies. Through collaboration, innovation, and informed decision-making, we can navigate the complexities of electromagnetic fields and harness their benefits while minimizing potential risks to society and the environment.

Categories
Science

Unlocking the Genetic Code: A Comprehensive Guide to Analyzing Inheritance Patterns and Understanding Genetic Traits

Introduction: Genetic inheritance patterns govern the transmission of genetic information from one generation to the next, shaping the characteristics and traits of individuals within a population. Understanding these inheritance patterns is fundamental to unraveling the complexities of human genetics, disease inheritance, and evolutionary biology. In this comprehensive guide, we delve into the intricacies of genetic inheritance patterns, exploring the principles, mechanisms, and analytical techniques involved in deciphering the genetic code and unraveling the mysteries of heredity.

  1. Principles of Genetic Inheritance: Genetic inheritance refers to the process by which genetic information is passed from parents to offspring through reproductive cells (gametes). The principles of genetic inheritance are governed by the laws of Mendelian genetics, proposed by Gregor Mendel in the 19th century. These laws include the law of segregation, which states that alleles (alternative forms of a gene) segregate randomly during gamete formation, and the law of independent assortment, which states that alleles of different genes assort independently of one another during gamete formation.
  2. Modes of Inheritance: Genetic traits can be inherited according to various patterns, including autosomal dominant, autosomal recessive, X-linked dominant, X-linked recessive, and mitochondrial inheritance. Autosomal dominant inheritance occurs when a single copy of a dominant allele is sufficient to produce a phenotype, while autosomal recessive inheritance requires two copies of a recessive allele. X-linked inheritance involves genes located on the X chromosome, with different inheritance patterns depending on whether the gene is dominant or recessive.
  3. Pedigree Analysis: Pedigree analysis is a powerful tool for studying genetic inheritance patterns in families and populations. Pedigrees are diagrams that depict the relationships among individuals within a family, tracing the transmission of genetic traits across multiple generations. Key features of pedigree analysis include identifying affected individuals (those exhibiting the trait of interest), determining the mode of inheritance, and calculating the probability of inheritance for future generations. Pedigree symbols and conventions are used to represent different phenotypes, genotypes, and relationships within a pedigree.
  4. Punnett Squares and Probability: Punnett squares are graphical tools used to predict the outcomes of genetic crosses and calculate the probabilities of specific genotypes and phenotypes in offspring. By combining alleles from parental gametes, Punnett squares allow for the visualization of genetic inheritance patterns and the determination of genotype frequencies in a population. Probability calculations based on Punnett squares rely on the principles of Mendelian genetics and the laws of probability, such as the multiplication rule and the addition rule.
  5. Genetic Linkage and Recombination: Genetic linkage refers to the tendency of genes located on the same chromosome to be inherited together during meiosis, due to their physical proximity. Genetic recombination, or crossing over, occurs during meiosis when homologous chromosomes exchange genetic material, resulting in the reshuffling of alleles and the creation of new combinations of genes. Genetic linkage and recombination influence the inheritance patterns of linked genes and contribute to genetic diversity within populations.
  6. Hardy-Weinberg Equilibrium: The Hardy-Weinberg equilibrium is a mathematical model used to describe the distribution of alleles and genotypes in a population that is not evolving. According to this model, allele frequencies remain constant from generation to generation in the absence of evolutionary forces such as mutation, migration, genetic drift, and natural selection. The Hardy-Weinberg equilibrium equation allows for the calculation of allele frequencies and genotype frequencies in a population based on observed genotype frequencies.
  7. Genetic Testing and Molecular Analysis: Advances in molecular biology and genetic technology have revolutionized the analysis of genetic inheritance patterns, allowing for the direct detection and characterization of genetic variants and mutations. Genetic testing techniques such as polymerase chain reaction (PCR), DNA sequencing, and microarray analysis enable the identification of disease-causing mutations, carrier status, and genetic predispositions to inherited disorders. Next-generation sequencing (NGS) technologies provide high-throughput sequencing of entire genomes, facilitating comprehensive analysis of genetic variation and inheritance patterns.
  8. Population Genetics and Evolutionary Dynamics: Population genetics is the study of genetic variation and evolutionary processes within populations, including genetic drift, gene flow, mutation, and natural selection. Population geneticists analyze allele frequencies, genetic diversity, and population structure to infer evolutionary relationships, migration patterns, and demographic history. Evolutionary dynamics shape genetic inheritance patterns over time, driving the emergence of new genetic traits and the adaptation of populations to changing environments.
  9. Genetic Counseling and Clinical Applications: Genetic counseling is a specialized field that provides guidance and support to individuals and families affected by genetic conditions, helping them understand the inheritance patterns, risks, and implications of genetic disorders. Genetic counselors use pedigree analysis, genetic testing, and risk assessment tools to educate clients about their genetic risks, explore reproductive options, and make informed decisions about family planning and medical management. Clinical applications of genetic analysis include prenatal diagnosis, carrier screening, predictive testing, and personalized medicine.
  10. Ethical, Legal, and Social Implications: The increasing availability and complexity of genetic information raise ethical, legal, and social concerns regarding privacy, consent, discrimination, and equity in healthcare. Genetic testing and genetic data sharing raise questions about informed consent, confidentiality, and the potential misuse of genetic information. Ethical frameworks, guidelines, and regulations are needed to ensure the responsible use of genetic data and promote equitable access to genetic services and technologies.

Conclusion: Analyzing genetic inheritance patterns is a multifaceted endeavor that combines principles of genetics, mathematics, and molecular biology to unravel the mysteries of heredity and genetic variation. By understanding the mechanisms and dynamics of genetic inheritance, scientists, researchers, and healthcare professionals can elucidate the genetic basis of disease, predict genetic risks, and develop strategies for disease prevention and personalized medicine. Through interdisciplinary collaboration, education, and ethical stewardship, the study of genetic inheritance patterns continues to advance our understanding of human genetics, evolution, and the complexity of life itself.

Categories
Science

Mastering the Art of Solution Concentration Determination: A Comprehensive Guide for Scientists, Chemists, and Researchers

Introduction: Determining the concentration of a solution is a fundamental task in chemistry and various scientific disciplines, essential for preparing solutions with precise compositions, conducting experiments, and analyzing reaction kinetics. Solution concentration refers to the amount of solute dissolved in a given quantity of solvent, typically expressed as moles per liter (M), mass per volume (g/L), or percentage (%). In this comprehensive guide, we delve into the intricacies of solution concentration determination, exploring the principles, methods, and considerations involved in accurately quantifying solution concentrations for a wide range of applications.

  1. Understanding Solution Concentration: Solution concentration is a measure of the relative amount of solute dissolved in a solvent, expressed as the ratio of solute quantity to solvent volume or mass. Common units of concentration include molarity (M), molality (m), normality (N), mass/volume (g/L or mg/mL), and percentage (%). The choice of concentration unit depends on the nature of the solute, solvent, and specific application, with each unit offering advantages and limitations in terms of precision, accuracy, and ease of use.
  2. Methods of Solution Preparation: Preparing solutions with accurate and precise concentrations requires careful measurement and calculation to achieve the desired solute-to-solvent ratio. Various methods can be used to prepare solutions, including volumetric dilution, mass-based dilution, serial dilution, and standard solution preparation. Volumetric glassware, such as volumetric flasks, pipettes, and burettes, are commonly used for accurate measurement of liquid volumes, while analytical balances are employed for precise weighing of solid solutes.
  3. Calculation of Solution Concentration: Once a solution is prepared, its concentration can be calculated using appropriate formulas and equations based on the chosen concentration unit. For example, molarity (M) is calculated by dividing the number of moles of solute by the volume of solution in liters (M = mol/L), while mass/volume concentration (g/L or mg/mL) is calculated by dividing the mass of solute by the volume of solution in liters or milliliters (g/L or mg/mL = g/mL or mg/mL). For dilute solutions, the dilution factor must be taken into account when calculating final concentrations after dilution.
  4. Spectrophotometric Analysis: Spectrophotometric analysis is a powerful technique for determining solution concentrations based on the measurement of light absorption or transmission properties of a solution. In UV-Visible spectrophotometry, the absorbance of a solution at a specific wavelength is directly proportional to its concentration, allowing for quantitative analysis of solute concentrations in solution. Standard calibration curves or Beer-Lambert law equations can be used to relate absorbance values to solute concentrations over a defined range.
  5. Titration Methods: Titration is a classical analytical technique used to determine solution concentrations by reacting a solution of known concentration (titrant) with a solution of unknown concentration (analyte) until the reaction reaches equivalence. Common types of titration methods include acid-base titrations, redox titrations, and complexometric titrations, each of which relies on specific chemical reactions and indicators to determine endpoint or equivalence point. Titration curves and stoichiometric calculations are used to calculate analyte concentrations based on the volume and concentration of titrant added.
  6. Chromatographic Techniques: Chromatographic techniques, such as high-performance liquid chromatography (HPLC) and gas chromatography (GC), are widely used for quantitative analysis of solution concentrations in complex mixtures. These techniques separate individual components of a solution based on their interactions with a stationary phase and mobile phase, allowing for precise quantification of solute concentrations. Detector signals or peak areas are correlated with solute concentrations using calibration standards or external calibration methods.
  7. Electrochemical Methods: Electrochemical methods, such as potentiometry, coulometry, and voltammetry, are employed for quantitative analysis of solution concentrations based on electrical properties of redox reactions or ion concentrations. These techniques involve measuring electrical potentials, currents, or charges generated during electrochemical reactions between analyte species and electrodes. Faraday’s laws of electrolysis and Nernst equation are used to calculate analyte concentrations from measured electrochemical parameters.
  8. Quality Assurance and Validation: Ensuring the accuracy and reliability of solution concentration measurements requires robust quality assurance practices and validation procedures. Calibration of instruments, verification of measurement techniques, and traceability to certified reference materials are essential for maintaining measurement accuracy and consistency. Quality control checks, proficiency testing, and inter-laboratory comparisons help identify and mitigate potential sources of error or variability in concentration determination.
  9. Data Analysis and Reporting: Analysis of solution concentration data involves statistical analysis, uncertainty estimation, and data interpretation to derive meaningful conclusions and make informed decisions. Statistical methods, such as regression analysis, confidence intervals, and hypothesis testing, are used to assess the reliability and significance of concentration measurements. Results are reported with appropriate units, significant figures, and uncertainty values to convey the precision and accuracy of the concentration determination process.
  10. Applications and Practical Considerations: Solution concentration determination finds applications in various fields, including analytical chemistry, pharmaceuticals, environmental monitoring, food and beverage analysis, and biotechnology. Accurate quantification of solution concentrations is essential for ensuring product quality, compliance with regulatory requirements, and safety of consumer products. Practical considerations, such as sample preparation, matrix effects, interference, and detection limits, must be taken into account when selecting appropriate methods and techniques for concentration determination.

Conclusion: Mastering the art of solution concentration determination is a multidimensional endeavor that requires a combination of theoretical knowledge, practical skills, and analytical techniques. By understanding the principles, methods, and considerations involved in quantifying solution concentrations, scientists, chemists, and researchers can achieve accurate and reliable results for a wide range of applications. Through continuous education, training, and innovation, solution concentration determination remains a cornerstone of analytical chemistry and scientific inquiry, driving advancements in research, technology, and industry.

Categories
Science

Deciphering the Mysteries of MRI Scans: A Comprehensive Guide to Interpretation and Diagnosis

Introduction: Magnetic Resonance Imaging (MRI) is a powerful medical imaging technique that provides detailed images of the body’s internal structures, allowing healthcare professionals to diagnose and monitor a wide range of medical conditions. Interpreting MRI scans requires specialized knowledge and expertise to accurately identify abnormalities, assess disease progression, and guide treatment decisions. In this comprehensive guide, we delve into the intricacies of MRI interpretation, exploring the principles, techniques, and considerations involved in analyzing MRI images for clinical diagnosis and management.

  1. Principles of MRI Imaging: MRI imaging relies on the principles of nuclear magnetic resonance (NMR) to generate high-resolution images of anatomical structures and physiological processes within the body. When placed in a strong magnetic field and exposed to radiofrequency pulses, hydrogen nuclei in water molecules align with the magnetic field and emit radiofrequency signals, which are detected by sensitive receivers and converted into images. Different tissues exhibit unique magnetic resonance properties, such as relaxation times and proton densities, which contribute to image contrast and tissue differentiation in MRI scans.
  2. Image Acquisition Techniques: MRI scanners utilize various imaging sequences and pulse sequences to capture different types of information about tissue composition, structure, and function. Common MRI sequences include T1-weighted imaging, T2-weighted imaging, proton density imaging, and diffusion-weighted imaging (DWI), each of which highlights specific tissue characteristics and pathological features. Advanced MRI techniques such as magnetic resonance angiography (MRA), magnetic resonance spectroscopy (MRS), and functional MRI (fMRI) provide additional insights into vascular anatomy, tissue metabolism, and brain function, respectively.
  3. Anatomical Landmarks and Normal Variants: Interpreting MRI scans requires a thorough understanding of anatomical landmarks and normal variants across different body regions. Radiologists and clinicians must be able to identify and differentiate normal anatomical structures, such as organs, blood vessels, nerves, and bones, from pathological findings. Knowledge of normal variants, such as anatomical variations, developmental anomalies, and incidental findings, is essential for distinguishing benign conditions from potential pathology and avoiding misinterpretation or unnecessary interventions.
  4. Recognizing Pathological Findings: MRI scans may reveal a wide range of pathological findings, including tumors, inflammation, infection, trauma, degeneration, and vascular abnormalities. Radiologists and clinicians must carefully evaluate MRI images for signs of abnormal tissue signal intensity, morphology, and enhancement patterns that may indicate underlying pathology. Common imaging features of pathology include mass effect, edema, necrosis, hemorrhage, enhancement, and diffusion restriction, which can vary depending on the nature and location of the underlying disease process.
  5. Differential Diagnosis and Pattern Recognition: Interpreting MRI scans often involves generating a comprehensive list of differential diagnoses based on the imaging findings and clinical context. Radiologists and clinicians rely on pattern recognition and diagnostic algorithms to systematically evaluate MRI images and prioritize potential etiologies for further investigation. Comparative analysis with previous imaging studies, laboratory tests, and clinical history is crucial for refining the differential diagnosis and guiding subsequent diagnostic workup and management.
  6. Quantitative Analysis and Image Post-processing: In addition to qualitative assessment, MRI interpretation may involve quantitative analysis and image post-processing techniques to extract numerical data and derive quantitative biomarkers of disease severity and treatment response. Quantitative MRI techniques, such as volumetric analysis, diffusion tensor imaging (DTI), and functional connectivity analysis, provide objective measures of tissue morphology, microstructure, and functional connectivity, which can aid in disease characterization and monitoring over time.
  7. Pitfalls and Artifacts: MRI interpretation is susceptible to various pitfalls and artifacts that can mimic or obscure pathological findings, leading to diagnostic errors or misinterpretation. Common MRI artifacts include motion artifacts, susceptibility artifacts, chemical shift artifacts, aliasing artifacts, and flow-related artifacts, which can arise from patient motion, magnetic field inhomogeneities, hardware imperfections, and physiological motion. Radiologists and clinicians must be aware of these artifacts and employ corrective measures to minimize their impact on image quality and diagnostic accuracy.
  8. Clinical Correlation and Multimodal Imaging: Effective MRI interpretation requires close collaboration between radiologists, clinicians, and other healthcare providers to integrate imaging findings with clinical data and laboratory results. Multimodal imaging approaches, such as combining MRI with computed tomography (CT), positron emission tomography (PET), ultrasound, or nuclear medicine imaging, offer complementary information and enhance diagnostic accuracy for complex cases. Clinical correlation and multidisciplinary discussions are essential for reaching consensus on diagnosis, treatment planning, and patient management.

Conclusion: Interpreting MRI scans is a complex and multidimensional process that requires a deep understanding of imaging principles, anatomical structures, pathological findings, and clinical correlations. By mastering the art of MRI interpretation, healthcare professionals can provide accurate diagnoses, personalized treatment plans, and optimal patient care across a wide range of medical specialties and clinical settings. Through continuous education, collaboration, and technological innovation, MRI imaging remains a cornerstone of modern medicine, driving advances in diagnosis, therapy, and patient outcomes.

Categories
Science

Mastering the Art of Soil Composition Analysis: A Comprehensive Guide for Researchers, Agriculturists, and Environmentalists

Introduction: Understanding the composition of soil is essential for a wide range of applications, from agriculture and environmental conservation to construction and land development. Soil composition analysis provides valuable insights into the physical, chemical, and biological properties of soil, enabling researchers, agriculturists, and environmentalists to make informed decisions about land use, soil management, and ecosystem restoration. In this comprehensive guide, we delve into the intricacies of soil composition analysis, exploring various methods, techniques, and considerations for accurate and meaningful soil characterization.

  1. Importance of Soil Composition Analysis: The composition of soil plays a critical role in determining its fertility, structure, drainage, and nutrient content—all of which are vital factors for plant growth, ecosystem health, and land productivity. Soil composition analysis provides valuable information about the texture, organic matter content, pH level, nutrient availability, and microbial activity of soil, allowing stakeholders to optimize agricultural practices, mitigate soil erosion, and conserve natural resources.
  2. Sampling Techniques: Effective soil composition analysis begins with proper sampling techniques to ensure representative and reliable results. Soil samples should be collected from multiple locations within a given area, taking into account factors such as soil type, land use, and topography. Sampling depth, timing, and frequency are also important considerations, as they can influence the variability and accuracy of soil composition data. Soil cores, augers, and probes are commonly used tools for collecting soil samples, with sampling grids and transects employed to ensure spatial representativeness.
  3. Physical Properties Analysis: Physical properties analysis focuses on the physical characteristics of soil, including texture, structure, porosity, and bulk density. Soil texture refers to the relative proportions of sand, silt, and clay particles, which influence water retention, drainage, and aeration. Soil structure refers to the arrangement of soil particles into aggregates or clods, affecting soil stability, root penetration, and microbial habitat. Porosity measures the volume of pore space within soil, while bulk density quantifies the mass of soil per unit volume, providing insights into soil compaction and root growth limitations.
  4. Chemical Properties Analysis: Chemical properties analysis assesses the chemical composition of soil, including pH level, nutrient content, cation exchange capacity (CEC), and salinity. Soil pH is a measure of soil acidity or alkalinity, influencing nutrient availability, microbial activity, and plant growth. Nutrient analysis involves quantifying essential elements such as nitrogen (N), phosphorus (P), potassium (K), calcium (Ca), magnesium (Mg), and sulfur (S), which are critical for plant nutrition and soil fertility. CEC measures the soil’s ability to retain and exchange cations, while salinity assesses the concentration of soluble salts in soil, which can impact plant health and water quality.
  5. Biological Properties Analysis: Biological properties analysis focuses on the microbial and faunal communities within soil, which play key roles in nutrient cycling, soil organic matter decomposition, and soil health maintenance. Microbial biomass, microbial diversity, and enzyme activity are commonly measured to assess soil biological activity and functionality. Faunal abundance, diversity, and functional guilds, such as earthworms, nematodes, and arthropods, are also evaluated to gauge soil ecosystem dynamics and resilience.
  6. Laboratory Analysis Methods: Laboratory analysis methods for soil composition analysis vary depending on the properties of interest and the desired level of detail and precision. Common laboratory techniques include particle size analysis using sedimentation or laser diffraction, soil pH measurement using potentiometric or colorimetric methods, nutrient analysis using chemical extraction and spectroscopic techniques, and microbial analysis using culture-based or molecular methods such as polymerase chain reaction (PCR) and next-generation sequencing (NGS).
  7. Field Analysis Methods: Field analysis methods offer rapid and cost-effective alternatives to laboratory analysis, allowing for on-site assessment of soil composition in real time. Portable devices and field kits are available for measuring soil pH, moisture content, electrical conductivity (EC), and nutrient levels using colorimetric, electrochemical, or optical sensors. Field observations such as soil color, odor, and texture can also provide valuable qualitative information about soil composition and condition.
  8. Data Interpretation and Management: Interpreting soil composition data requires careful consideration of variability, uncertainty, and spatial heterogeneity within the sampled area. Statistical analysis techniques such as descriptive statistics, regression analysis, and geostatistics are employed to identify patterns, trends, and correlations in soil composition data. Geographic information systems (GIS) and remote sensing technologies are used to visualize and spatially analyze soil composition data, facilitating decision-making and land management planning.
  9. Application of Soil Composition Analysis: Soil composition analysis finds applications in a wide range of fields, including agriculture, forestry, environmental science, land use planning, and engineering. In agriculture, soil composition data is used to optimize fertilizer application, improve crop productivity, and mitigate soil erosion. In forestry, soil composition analysis informs reforestation efforts, watershed management, and habitat restoration projects. In environmental science, soil composition data helps assess soil contamination, monitor land degradation, and evaluate ecosystem health.
  10. Challenges and Considerations: Despite its importance, soil composition analysis faces several challenges, including variability in soil properties, sampling bias, and data interpretation limitations. Standardization of sampling protocols, quality control measures, and data validation procedures are essential for ensuring the reliability and comparability of soil composition data. Interdisciplinary collaboration and integration of multiple data sources are also critical for addressing complex soil-landscape interactions and facilitating sustainable land management practices.

Conclusion: Mastering the art of soil composition analysis is a multifaceted endeavor that requires interdisciplinary expertise, advanced technologies, and systematic approaches. By understanding the physical, chemical, and biological properties of soil, stakeholders can make informed decisions about land use, soil management, and environmental conservation. Through proper sampling, rigorous analysis, and thoughtful interpretation, soil composition analysis serves as a cornerstone for sustainable development, ecosystem resilience, and global food security in an ever-changing world.