Introduction:
Understanding the break-even point is essential for businesses of all sizes, as it represents the point at which total revenue equals total costs, resulting in neither profit nor loss. Calculating the break-even point provides valuable insights into a company’s financial performance, helping management make informed decisions regarding pricing strategies, production levels, and sales targets. In this extensive guide, we’ll delve deep into the intricacies of calculating the break-even point, providing readers with a comprehensive toolkit to navigate profitability with precision and confidence.
Understanding the Break-Even Point:
Before delving into the calculation methods, it’s crucial to grasp the concept of the break-even point. The break-even point is the level of sales or production at which total revenue equals total costs, resulting in a net profit of zero. At this point, the company covers all its fixed and variable costs, but does not generate any additional profit beyond the break-even level. Understanding the break-even point allows businesses to assess the minimum level of sales or production required to cover costs and achieve profitability.
Calculating the Break-Even Point:
The break-even point can be calculated using various methods, including the formula method, the contribution margin method, and the graphical method. Each method provides a unique perspective on the break-even analysis, allowing businesses to choose the approach that best suits their needs and preferences.
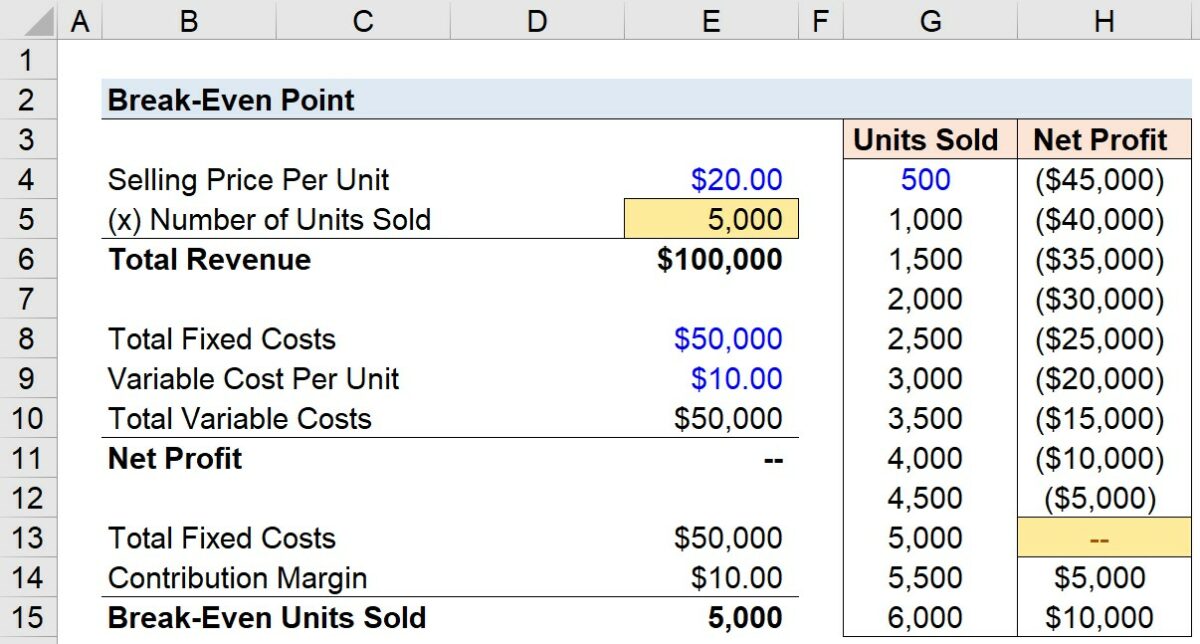
- Formula Method: The formula method calculates the break-even point by dividing total fixed costs by the contribution margin per unit. The contribution margin represents the difference between the selling price per unit and the variable cost per unit.
Break-Even Point (in units) = Total Fixed Costs / Contribution Margin Per Unit
Break-Even Point (in dollars) = Break-Even Point (in units) * Selling Price Per Unit
- Contribution Margin Method: The contribution margin method focuses on the contribution margin ratio, which is the contribution margin per unit divided by the selling price per unit. The break-even point is then calculated by dividing total fixed costs by the contribution margin ratio.
Break-Even Point (in units) = Total Fixed Costs / Contribution Margin Ratio
Break-Even Point (in dollars) = Break-Even Point (in units) * Selling Price Per Unit
- Graphical Method: The graphical method involves plotting the total revenue and total cost curves on a graph and identifying the point at which the two curves intersect. This intersection represents the break-even point, where total revenue equals total costs.
Interpreting the Break-Even Analysis:
Once the break-even point is calculated, businesses can interpret the results to make informed decisions regarding pricing strategies, production levels, and sales targets. A break-even analysis provides insights into the following key areas:
- Profitability Assessment: The break-even analysis allows businesses to assess the profitability of their products or services by identifying the minimum level of sales required to cover costs.
- Risk Management: Understanding the break-even point helps businesses mitigate risks associated with changes in costs, prices, or sales volumes, allowing for proactive decision-making.
- Performance Evaluation: By comparing actual sales or production levels to the break-even point, businesses can evaluate their performance and identify areas for improvement.
- Strategic Planning: Break-even analysis informs strategic planning initiatives, such as pricing strategies, cost reduction efforts, and resource allocation decisions.
Practical Example:
Let’s consider a hypothetical example to illustrate the calculation of the break-even point:
- Company XYZ sells a product for $50 per unit.
- The variable cost per unit is $30, and the total fixed costs amount to $60,000.
Using the formula method:
Contribution Margin Per Unit = Selling Price Per Unit – Variable Cost Per Unit = $50 – $30 = $20
Break-Even Point (in units) = Total Fixed Costs / Contribution Margin Per Unit = $60,000 / $20 = 3,000 units
Break-Even Point (in dollars) = Break-Even Point (in units) * Selling Price Per Unit = 3,000 units * $50 = $150,000
Conclusion:
In conclusion, calculating the break-even point is a fundamental aspect of financial analysis for businesses seeking to assess profitability, manage risks, and make informed decisions. By understanding the concepts, methods, and implications of break-even analysis, businesses can navigate profitability with precision and confidence, optimizing performance and achieving sustainable growth. Whether evaluating pricing strategies, setting sales targets, or conducting scenario analysis, the break-even point serves as a valuable tool for financial management and strategic planning. So dive into break-even analysis today, unlock insights into your business’s financial performance, and chart a course towards profitability and success with confidence and clarity.